„We make investment strategies measurable.“
The investment portfolios of our discretionary portfolio management clients are designed to fit the clients’ needs. The most attention is put on the satisfaction of the client with his/her portfolio development.
The performance of the most representative portfolios of our clients are as follows (unweighted, after deduction of all related costs and withholding taxes):
Cumulated Performance
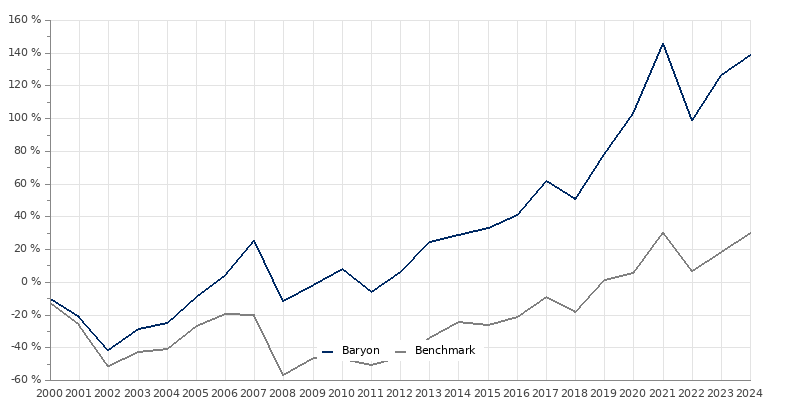
Comparison
Comparison as per
February 2024
Benchmark
Equities World (MSCI Free)
| Year | Period | Cumulated | ||
| Performance | Benchmark | Performance | Benchmark | |
| 2024 February | 5.3 | 10.2 | 138.4 | 30.1 |
| 2023 | 13.9 | 10.8 | 126.4 | 18.1 |
| 2022 | -19.1 | -18.2 | 98.8 | 6.6 |
| 2021 | 20.9 | 23.8 | 145.8 | 30.3 |
| 2020 | 14.0 | 4.1 | 103.2 | 5.3 |
| 2019 | 18.3 | 23.8 | 78.3 | 1.1 |
| 2018 | -6.7 | -10.0 | 50.7 | -18.4 |
| 2017 | 14.6 | 15.2 | 61.4 | -9.3 |
| 2016 | 5.9 | 6.9 | 40.8 | -21.2 |
| 2015 | 3.6 | -2.0 | 33 | -26.3 |
| 2014 | 3.2 | 15 | 28.4 | -24.8 |
| 2013 | 17.3 | 20.6 | 24.5 | -34.6 |
| 2012 | 13.0 | 10.8 | 6.1 | -45.8 |
| 2011 | -13.1 | -7.3 | -6.1 | -51.1 |
| 2010 | 9.9 | -1.2 | 8.0 | -47.2 |
| 2009 | 11.6 | 23.3 | -1.7 | -46.5 |
| 2008 | -29.7 | -45.6 | -11.9 | -56.7 |
| 2007 | 20.2 | -0.7 | 25.3 | -20.4 |
| 2006 | 15.1 | 9.5 | 4.3 | -19.8 |
| 2005 | 21.4 | 24.0 | -9.4 | -26.8 |
| 2004 | 4.7 | 3.6 | -25.4 | -41.0 |
| 2003 | 22.7 | 17.6 | -28.7 | -43.0 |
| 2002 | -25.7 | -34.3 | -41.9 | -51.6 |
| 2001 | -12.9 | -15.6 | -21.8 | -26.3 |
| 2000 | -10.2 | -12.7 | -10.2 | -12.7 |
Performance Data last updated on March 13, 2024